Is there any external tool to makes graphs of the log data to compare mapping versions and optimize performance?
Simple metrics like
- messages per second over time
- latency between MIDI-IN->MIDI-OUT on different devices
- etc
If not, I will build a quick ipyhton notebook that consumes the log output.
UPDATE: python script now produces this graph:
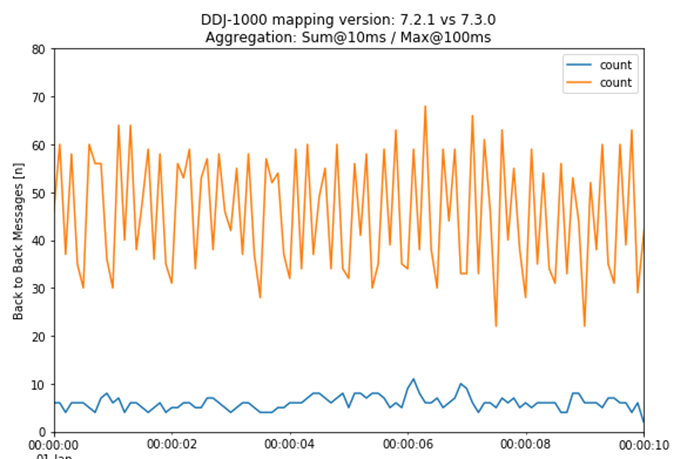
source code:
SteveC
(Steve)
2
Hi Pedro,
I'm not aware of any. You are the first person that I know of that asked.
Steve Caldwell
Bome Customer Care
Also available for paid consulting services: bome@sniz.biz
no problem, will share later.
Also, FYI an index of advanced topics that I’m aware: https://www.bome.com/support/kb/index-of-advanced-posts-and-tools
UPDATE: python script now produces this graph:
source code: